How do people migrate?
A Post-Pandemic Rebound? Migration and mobility globally after Covid-19
From 2012 to 2020 (until COVID-19), more than 1 billion people used air transport to move around the world each year. The figure to the right, taken from WMR 2018 and based on data from the World Tourism Organization, shows a linear increase in international tourist arrivals from 1995 to 2016. This changed dramatically in 2020 due to the COVID-19 global pandemic.
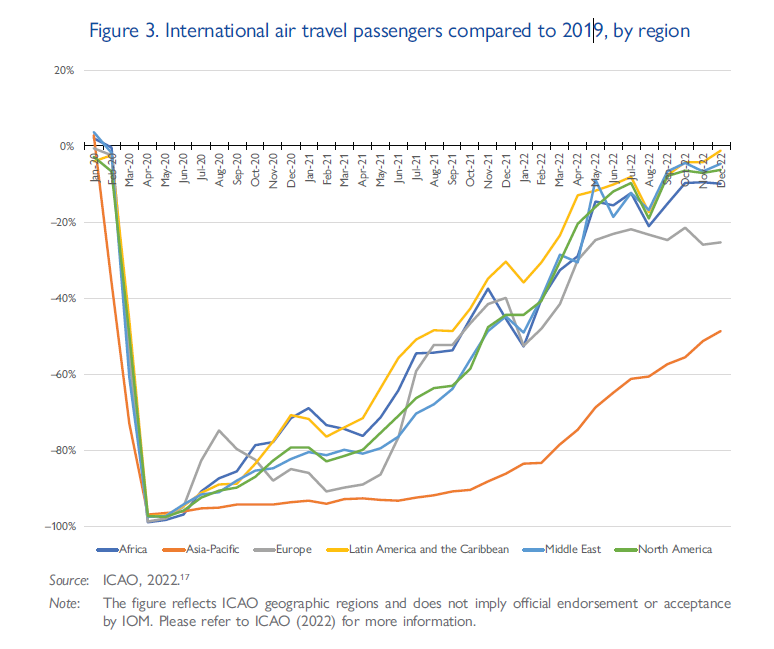
International air travel
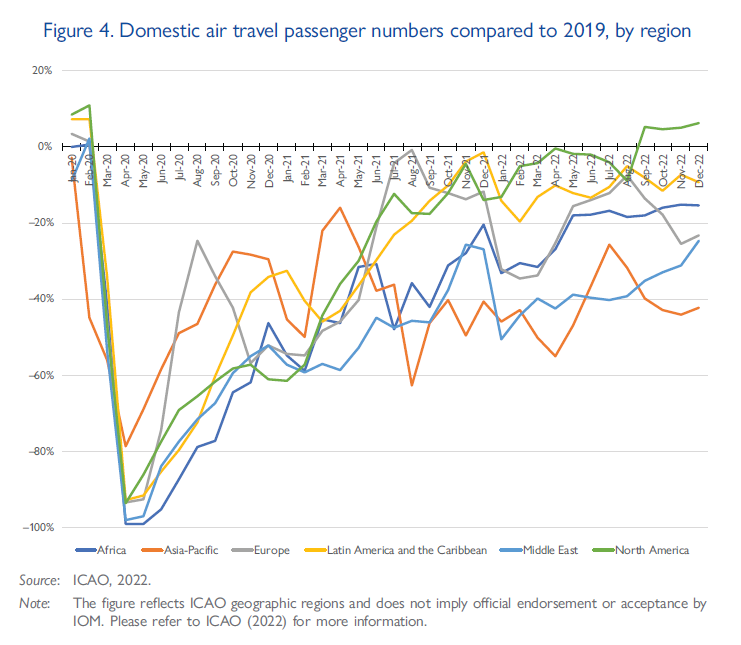
Domestic air travel
How did international air travel passenger numbers in December 2022 compare to 2019 levels across different regions?
Which world region experienced the slowest recovery of international air travel by December 2022 compared to February 2020? Why do you think this region was different?
AfricaAsia-PacificEuropeLatin America and the CaribbeanMiddle EastNorth AmericaWhich world region experienced the fastest recovery of domestic air travel by December 2022 compared to February 2020? Why do you think this region was different?
AfricaAsia-PacificEuropeLatin America and the CaribbeanMiddle EastNorth America
Print the page or save to PDF